New aggregation functions: GROUPBY and PIVOTBY
I’m excited to announce Excel's new GROUPBY and PIVOTBY functions. These functions allow you to perform data aggregations using a single formula. And while these functions are extremely powerful, they are also simple to get started with. In fact, you can do a data aggregation with just 3 arguments, the same number as a simple XLOOKUP.
Note: These are preview functions, their signature and results may change substantially before final release based on user feedback. Until final, we do not recommend using them in important workbooks.
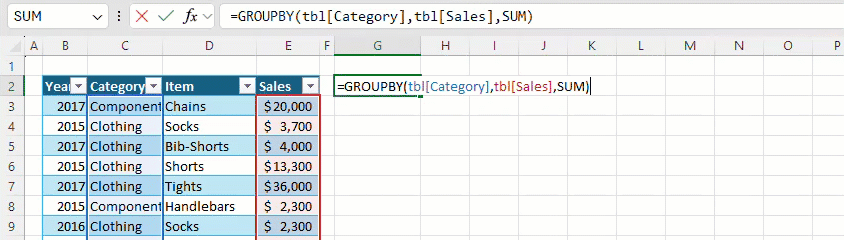
GROUPBY
To do a simple GROUPBY, you need just 3 arguments: i) What to group by, ii) the values to aggregate and iii) the function you'd like to use for the aggregation.
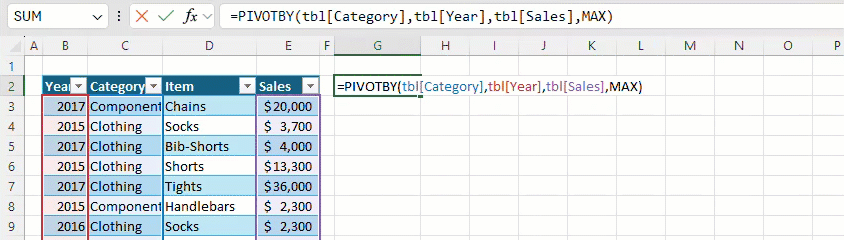
PIVOTBY
PIVOTBY is the same as GROUPBY but it let's you group by column too.
Functions as arguments
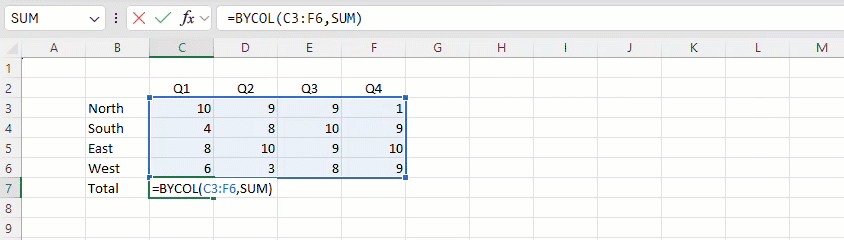
In the examples above, we pass the SUM and MAX functions to GROUPBY and PIVOTBY respectively. These are lambda functions, “eta reduced lambda” functions to be precise. And while they have a complex name, they are extreme easy and intuitive to use – you don’t even need to know anything about lambda functions you can just pick them from a list.

We also added eta lambda support to our all our functions that accept lambdas, greatly improving formula readability for simple scenarios. Consider the BYCOL example below. Previously you'd have to have write: =BYCOL(C3:F6,LAMBDA(x,SUM(x))
Function Signature
GROUPBY and PIVOTBY have additional arguments that give you control of their outputs. For instance, you can control how they sort, whether your data has headers, and whether you want to filter out some values.
You can see their full signatures below.
GROUPBY(row_fields,values,function,[field_headers],[total_depth],[sort_order],[filter_array])
PIVOTBY(row_fields,col_fields,values,function,[field_headers],[row_total_depth],[row_sort_order],[col_total_depth],
         [col_sort_order],[filter_array])
Detailed information on these arguments can be found on the function help pages. (link, link)
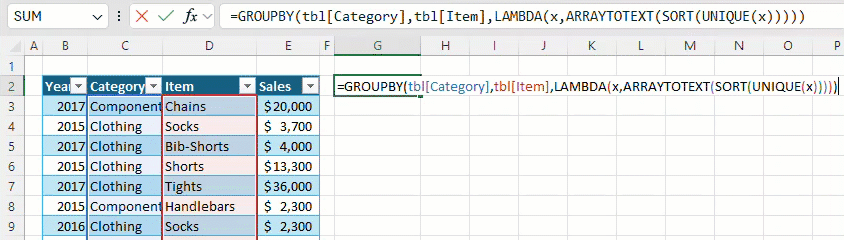
Why use GROUPBY and PIVOTBY?
As functions, GROUPBY and PIVOTBY are lightweight, fully descriptive, automatically update and can depend on the result of other calculations. They also aggregate using lambda functions which unlock new aggregation capabilities.
Consider the following example where I aggregate text values. Here I make use of a lambda to sort the unique items before joining them together using ARRAYTOTEXT. This type of aggregation was previously impossible in Excel.
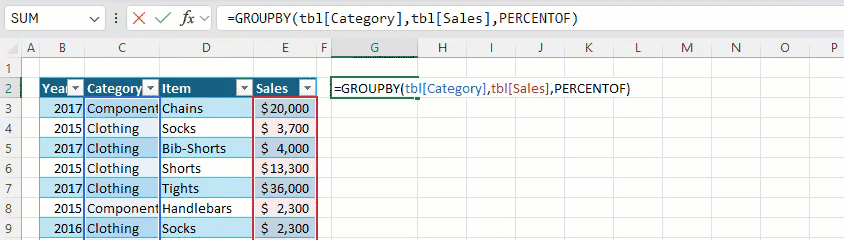
Bonus function
We added an additional function: PERCENTOF. It's a simple function that SUM's its first argument and divides by the SUM of its second argument. While you can use it on its own, it's particularly useful with GROUPBY and PIVOTBY as it allows you to return percentages.
PERCENTOF(data_subset,data_all)
More information on the PERCENTOF function can be found on the help page. (link)
Don’t have it yet? It’s probably us, not you.
Features are released over some time to ensure things are working smoothly. We highlight features that you may not have because they’re slowly releasing to larger numbers of Insiders. Sometimes we remove elements to further improve them based on your feedback. Though this is rare, we also reserve the option to pull a feature entirely out of the product, even if you, as an Insider, have had the opportunity to try it.
Feedback
If you have any feedback or suggestions, you can submit them by clicking Help > Feedback. You can also submit new ideas or vote for other ideas via Microsoft Feedback.
Want to know more about Excel? See What's new in Excel and subscribe to our Excel Blog to get the latest updates. Stay connected with us and other Excel fans around the world – join our Excel Community and follow us on Twitter.
source
Joe McDaid (@jjmcdaid)
Program Manager, Excel
ليست هناك تعليقات:
إرسال تعليق